Support & Resistance Indicator MT5
MetaTrader 5
This Support and Resistance MT5 indicator automatically identifies key support and resistance levels on MetaTrader 5 and highlights potential rebound zones where price is likely to react. By parsing historical price data and volume clusters in real time, the software isolates high-liquidity zones where institutional buy and sell orders are resting. Instead of forcing you to manually draw outdated lines, it maps out fluid, objective price boundaries that adjust to shifting market conditions. This clear layout gives you a distinct edge when confirming trend reversals, managing risk near critical breakout points, and setting highly accurate stop-loss and take-profit targets.
Alternative download link Added to cart — redirecting to checkout in 3 seconds...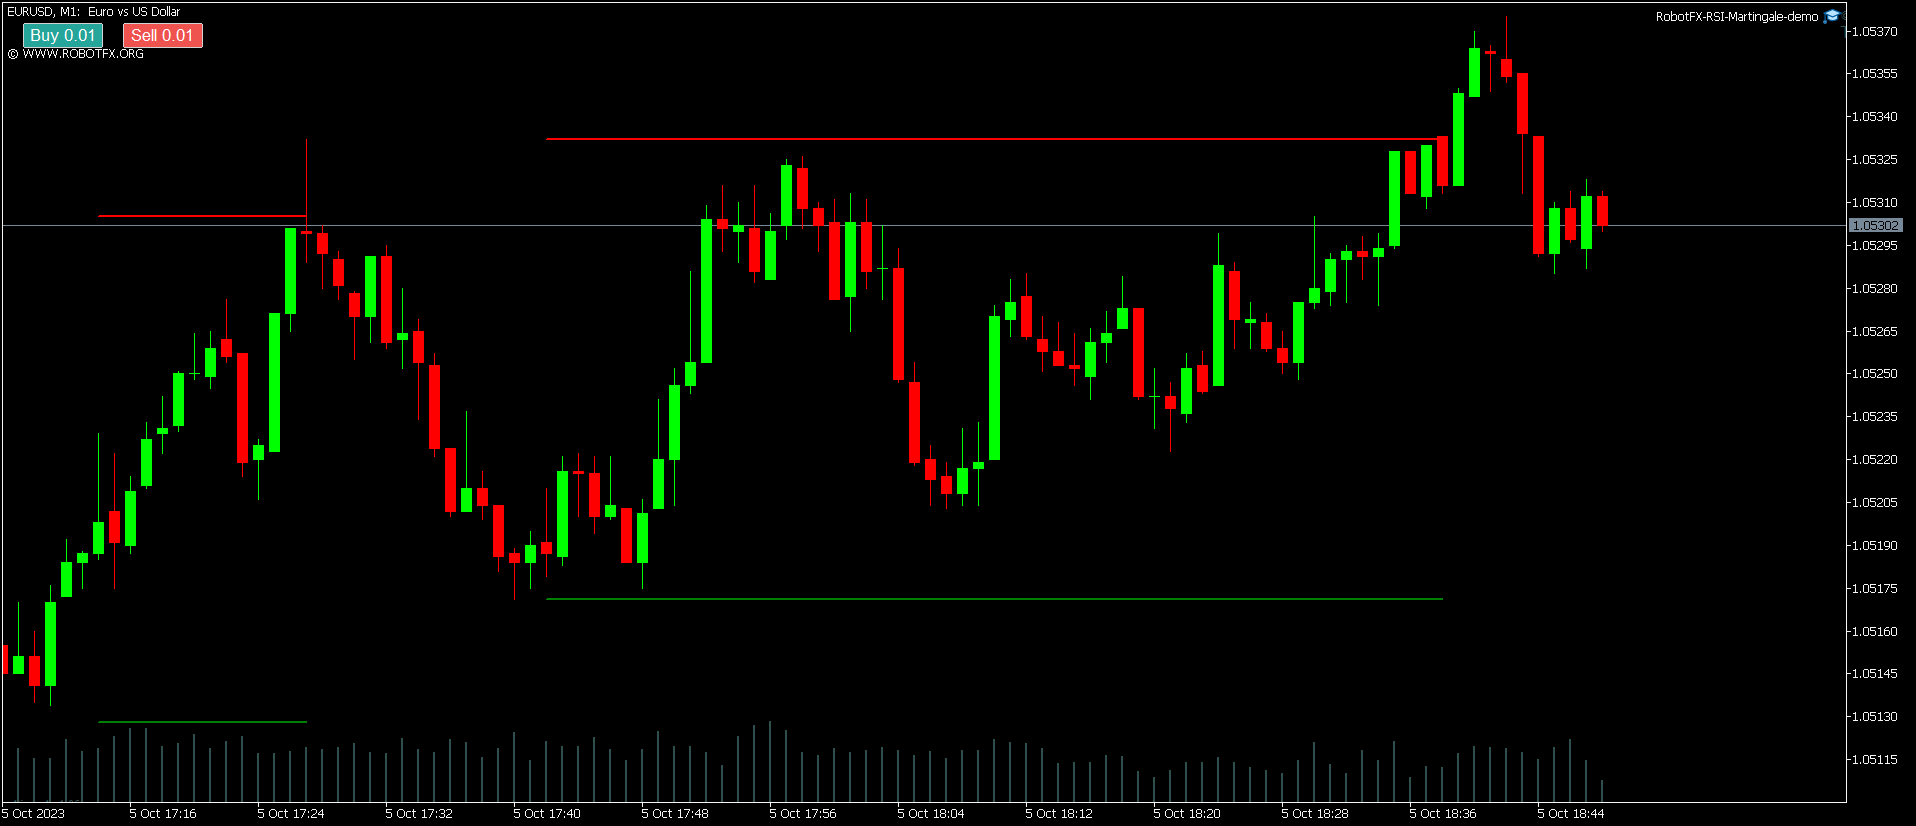
Key Features of the Support & Resistance Indicator MT5
The Support and Resistance Indicator for MetaTrader 5 is designed to detect strong horizontal levels where price has previously reversed. It marks support as the lowest low and resistance as the highest high within a defined period, helping traders spot high-probability bounce and breakout zones using support and resistance analysis.
Support & Resistance Indicator MT5 Trade Examples
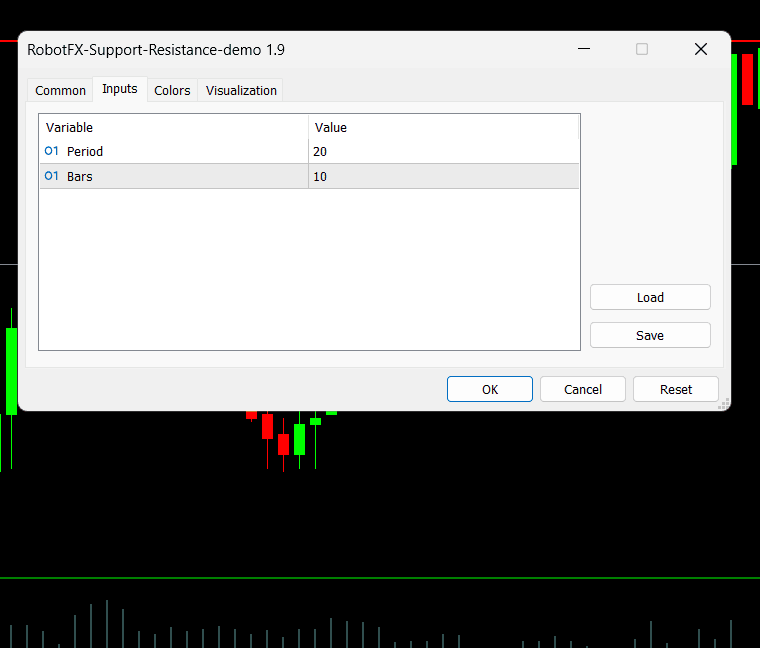
Configuring Support & Resistance Indicator MT5 Settings
How to Use Support and Resistance Indicator MT5
- Install the indicator on your MetaTrader 5 platform.
- Attach it to any chart and timeframe (H1, H4, and Daily work especially well).
- Adjust the Period and Bars parameters to match your trading style.
- Look for clear support and resistance levels drawn by the indicator.
- Use bounces from these levels as high-probability entry points or breakouts as trend continuation signals.
Frequently Asked Questions
Q: Is the Support and Resistance indicator only for MT5?
Yes, this version is built specifically for MetaTrader 5.
Q: How does the indicator detect support and resistance?
It identifies support as the lowest low and resistance as the highest high
within the defined period and bars, then draws the levels when price rebounds
between them.
Q: Can I adjust how sensitive the levels are?
Yes. By changing the Period and Bars parameters, you can make the indicator
detect shorter-term or longer-term support and resistance zones.
Q: Is it suitable for beginners?
Yes. The visual levels are easy to understand and very useful for learning how
to trade support and resistance effectively.
RobotFX Suggested Video
The video will explain how the RobotFX Auto Recovery works and the strategy behind the loss recovery. Feel free to watch the rest of the videos too.