Guppy Indicator MT5
MetaTrader 5
The Guppy Indicator for MetaTrader 5 (MT5) is a multi–moving average analysis tool that helps traders understand how market participants behave using two groups of averages. It highlights areas of consensus and conflict that often appear before major trend shifts. By splitting short-term retail traders and long-term institutional investors into distinct visual bands, the software uncovers the true sentiment driving price movement. When these groups expand in unison, it validates a powerful trend continuation, whereas compression between the groups flags structural exhaustion. This allows traders to confidently ride major momentum cycles, avoid premature entries during market consolidation, and pinpoint exactly when big money is shifting direction.
Alternative download link Added to cart — redirecting to checkout in 3 seconds...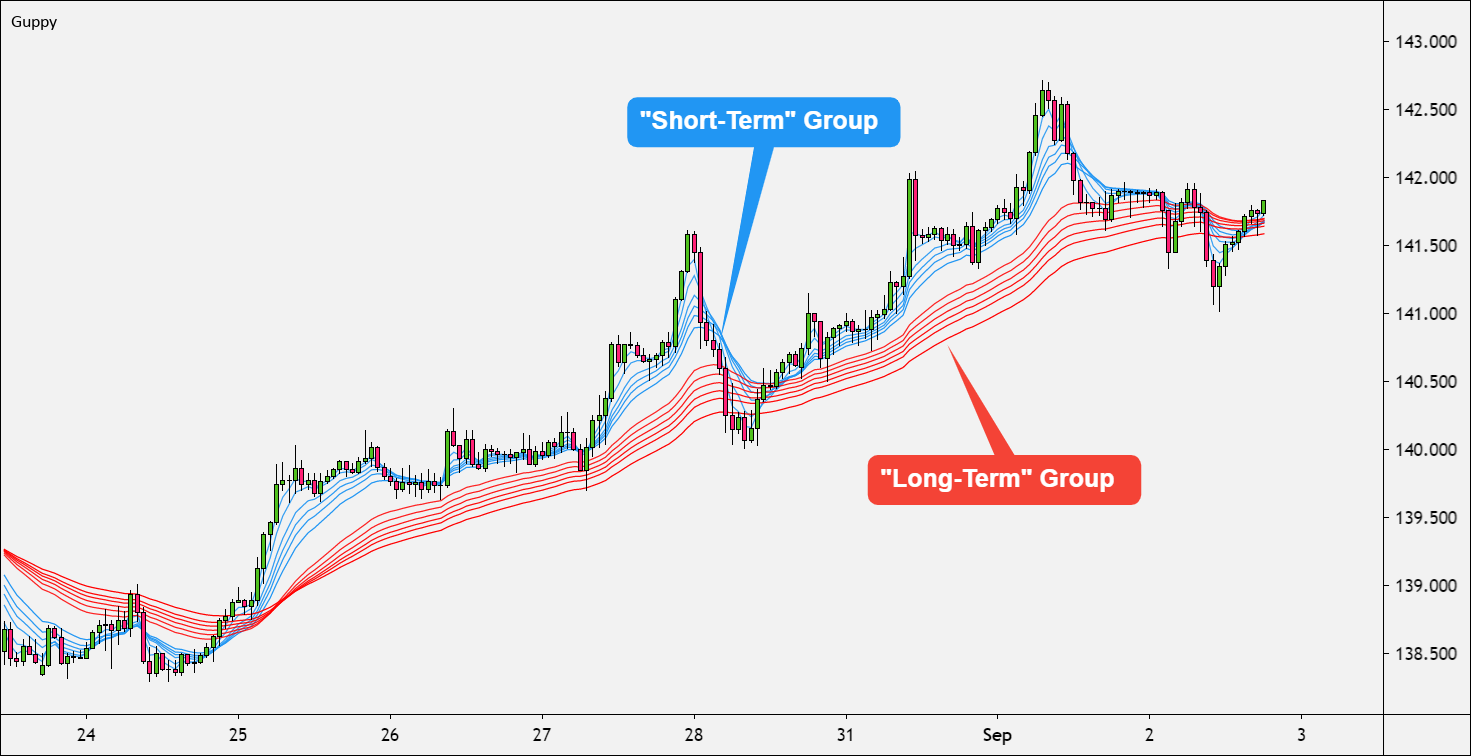
Key Features of the Guppy Indicator MT5
Although the original Guppy concept is based on exponential moving averages (EMA), this MT5 Guppy Indicator allows full customization using any type of moving average across all timeframes. You can adjust colors, lengths, and visual structure directly from the settings panel.
The indicator helps traders identify the quality and strength of a trend by measuring how price interacts with short-term and long-term average groups. It also evaluates trading activity, showing when a trend is strong, weakening, or transitioning into consolidation.
This makes it useful for multiple strategies including trend following, breakout trading, and intraday analysis. It is also widely used for long-term market structure evaluation.
Guppy Indicator MT5 Trade Examples
Guppy strategy
- Enter trends during early price expansion phases
- Join trends when price confirms new highs or lows
- Trade breakouts using pullbacks and continuation moves
- Trade retracements within strong directional trends
- Identify trend reversals as group compression develops
Basic rules
- Trend strength depends on separation within long-term averages
- Market activity is reflected by short-term average spacing
- Trend quality is defined by interaction between both groups
- Compression indicates agreement on price value and possible transition
- Full compression of both groups often signals major trend change
- Trade with the dominant long-term structure
- The indicator defines trend behavior, not direct buy/sell crossovers
Pros
- Improves overall trend analysis clarity
- Helps select appropriate trading strategies
- Measures trend strength and sustainability
- Identifies abnormal price behavior (spikes and dips)
- Improves understanding of market participant behavior
Cons
- Less effective in sideways or range-bound markets
- Not suitable for all market conditions
- Should not be used as a simple moving average crossover system
RobotFX Suggested Video
The video will explain how the RobotFX Auto Recovery works and the strategy behind the loss recovery. Feel free to watch the rest of the videos too.